Total ozone and aerosol optical depth
Total ozone is derived from direct spectral irradiance (DSI) with a
method similar to that employed by the Dobson and Brewer instruments;
for details of the method please
see [Mayer and Seckmeyer,
1998] or [Mayer et al., 1997].
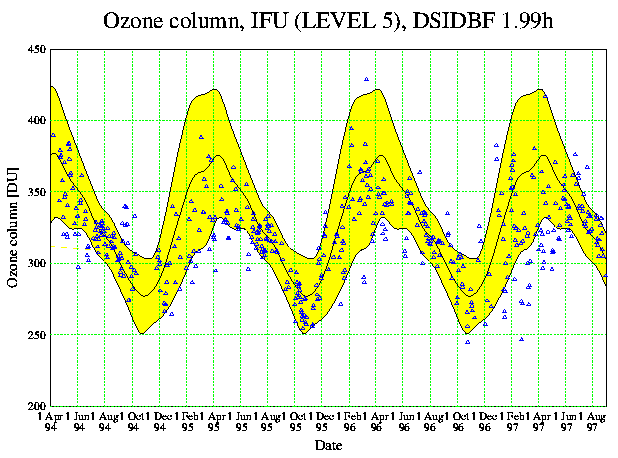
The graph shows the time series of daily averaged total ozone,
measured at Garmisch-Partenkirchen. The yellow area shows the
longterm (1968-1993) monthly averages measured at the nearby
station Hohenpeissenberg ± 2 standard deviations.
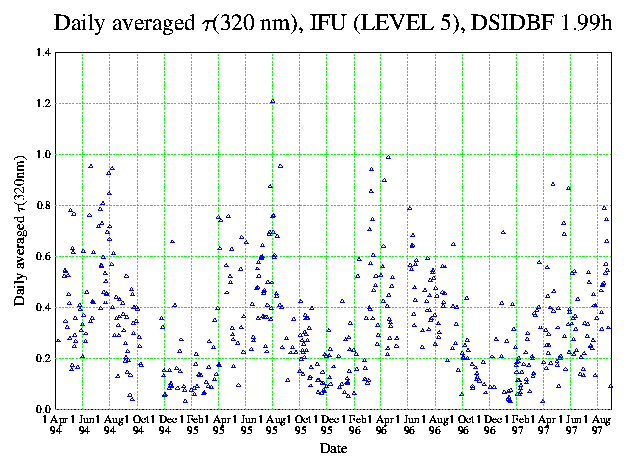
The calibrated measurement of direct spectral irradiance allows the
calculation of aerosol optical depth following Lambert-Beer's law.
For details see e.g.
[Mayer and Seckmeyer, 1998]. The graph shows the daily
averaged aerosol optical depth at 320 nm. The pronounced annual variability
is probably due to the larger humidity during summer, resulting in
the growth of the aerosol particles leading to an increase in the
scattering optical depth.
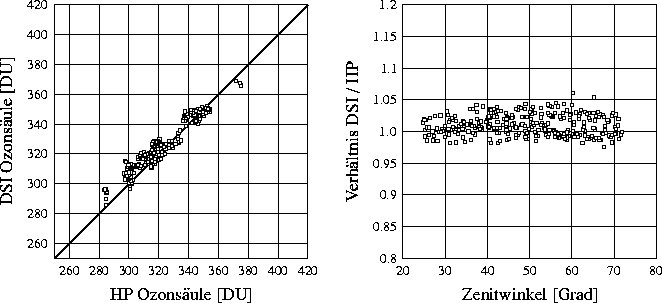
Comparison of the ozone data, derived from direct spectral
irradiance (DSI), with Brewer data measured at the nearby station
Hohenpeissenberg. Each data point shows a single DSI ozone
measurement. For the comparison, the Brewer data were interpolated to
the DSI measurement times. The right plot
shows the ratio between DSI and Brewer data as a function of solar
zenith angle. The average ratio is 1.01 and the standard deviation is 0.016.
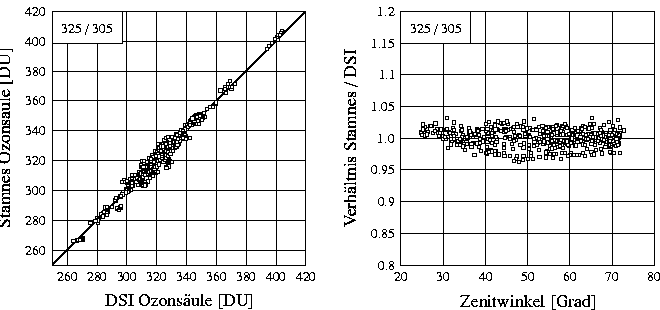
[Stamnes et al., 1991]
proposed a method to derive total ozone from measurements
of global irradiance at two wavelengths. The figure shows the results
of a slightly modified Stamnes algorithm in comparison with the
direct spectral irradiance (DSI) results. The average ratio is
1.00, the standard deviation is 0.014. For details of the method
please refer to
[Mayer and Seckmeyer, 1998].
References
- 1
-
Stamnes, K., J. Slusser, and M. Bowen.
Derivation of total ozone abundance and cloud
effects from spectral irradiance measurements. Applied Optics,
30, 4418-4426, 1991.